 The UKNIAF Power team met with the GIZ Nigeria Energy Support Programme on the Service-Based Tariff (SBT) dashboard developed for Nigeria Electric Regulatory Commission. The meeting explored potential opportunities and synergies offered by the SBT Dashboard to increase the pace and impact of energy access initiatives by both agencies.
In 2020, NERC implemented the Service-Based Tariff for the Nigerian Electricity Supply Industry (NESI) to address consumer sentiments about service quality in the transition to cost-reflective tariffs. The difficulty NERC faced was determining how to compare the DisCos’ quality of delivery, measured by the number of hours of power supplied to consumers, to their commitments in the Service Level Agreements (SLA) that underpin the SBT Tariff Bands.
Given the challenges that existed and still exist with metering across the network, there was no quick and transparent means for NERC to access performance data that would enable the tracking of DisCos’ power supply performance. With the realities of largely un-metered consumers and network meters (at 33kV and 1111kV) that are mostly not smart, UKNIAF developed a unique solution to these challenges that provides near real-time performance data from network meters at both 33kV and 11kV. With this solution, NERC is now able to monitor DisCos SBT SLA compliance at all 11kV feeders. The solution also features a range of supporting compliance and data integrity controls.
The SBT Dashboard is currently in use at NERC for monitoring the performance of DisCos against their SBT SLA commitments.
Some of the key functionalities of the SBT Dashboard include:
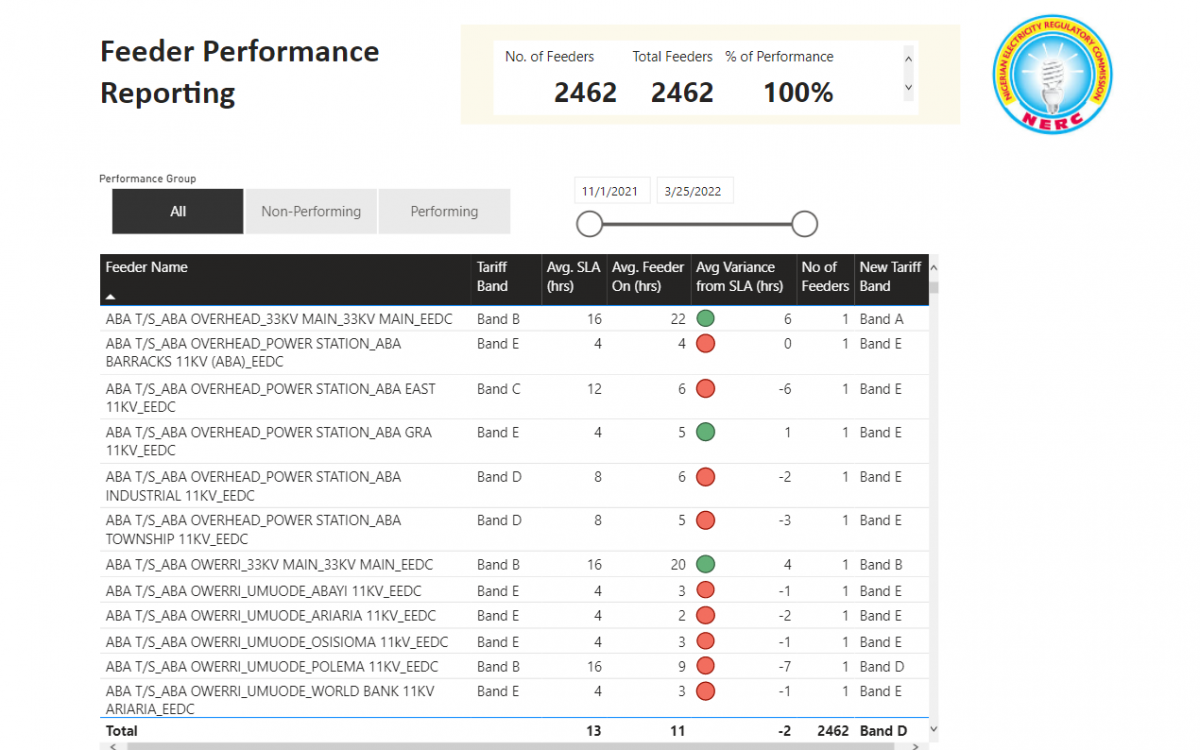
- Feeder Performance Reporting: Tracking the performance of every feeder on the network against the SLA of the Tariff Band to which it is assigned.
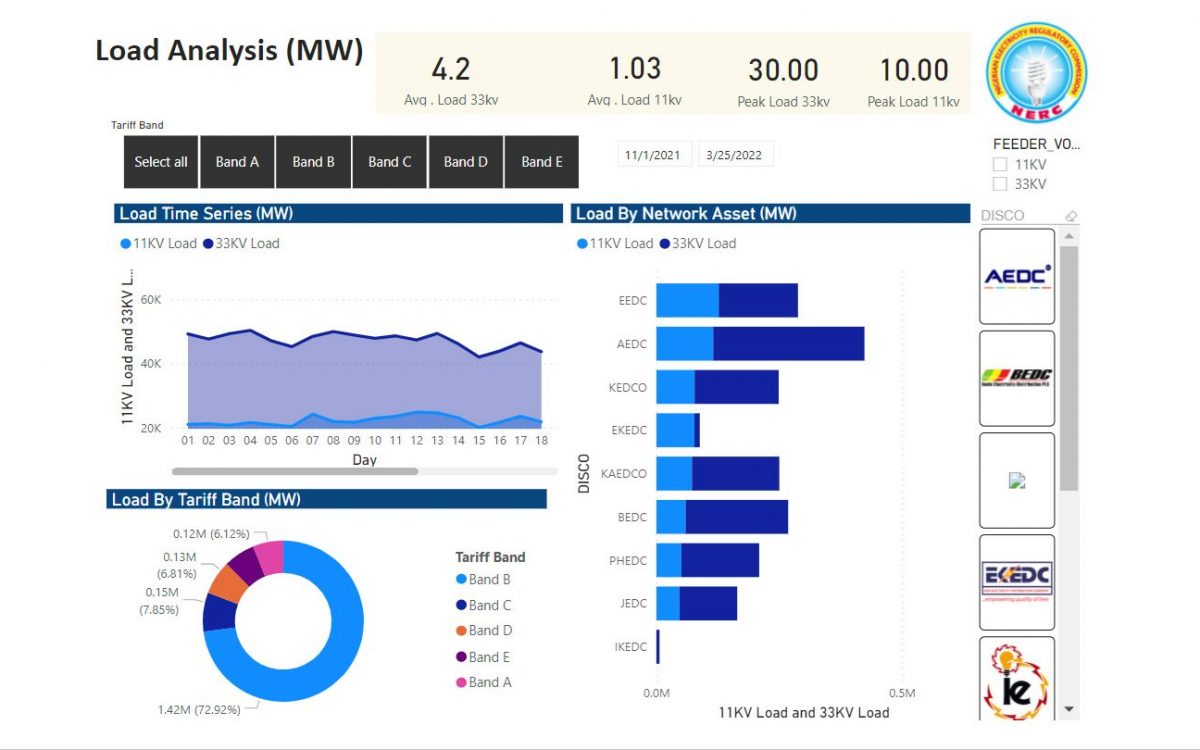
- Load Analysis: Displays the load profile across the 33 kV and 11 kV network segments, showing the load curve at each hour of the day with drill down functionality for a more detailed look at the performance sheets.
- Carbon Emissions from Electricity Consumption: The generation side shows the CO2 emission associated with the power generated from each GenCo by turbine type. The distribution side shows the amount of CO2 associated with the power distributed by each DisCo down to the feeder level. These can help NERC with energy mix planning (generation) and Energy Efficiency initiatives (distribution).
The figures below show examples of each of these functionalities
The Dashboard’s next iteration:
Work on the Dashboard’s next iteration is currently underway and expected to be completed in March 2023. New functionality will be develop to integrate commercial data from the DisCos, matching consumers to the feeders that supply them and thus enable NERC to independently identify consumers that are being under- or over-served. Armed with this data, NERC will be able to institute compensation mechanisms. Additional functionality will also be introduced to help NERC in driving the implementation of its Energy Efficiency regulations currently under review to reduce carbon emissions at consumer level.


